Visualizing element fields using contours (isosurfaces and isolines)
Contours are graphical representations used to visualize 3D or 2D objects that connect every point where the value of a certain field is the same. This idea is analogous to the contour lines on a map, where a line connects every point of a certain height. In 3D this means that a surface connects every point of a certain value. An example of this is in example a7 where an iso-surface is used to show the surface where every point is at 100 degrees Celsius. For a simpler example, example a2 shows the creation of an iso-surface at x=0.5 within the simple cube mesh.
Note: prior to Cmgui v3.0, contours were called isosurfaces.
Apart from the coordinate field, contours require the selection of the 'iso-scalar field' for which you want to visualise contours of constant value, and the iso-values you wish to see. Iso-values can be specied either by a space-separated list of explicit values, or as a sequence consisting of a number of values and the first and last value, with sampling evenly spaced between them.
As with surfaces, the detail level of iso-surfaces is determined by the selected tessellation setting in settings editor area of the scene editor (Figure 2). Iso-surfaces are drawn to connect points on the edges of the sub-element divisions where the iso-scalar matches the chosen value. With an tessellation setting of 1, an iso-surface will only connect points on the line edges of the element.
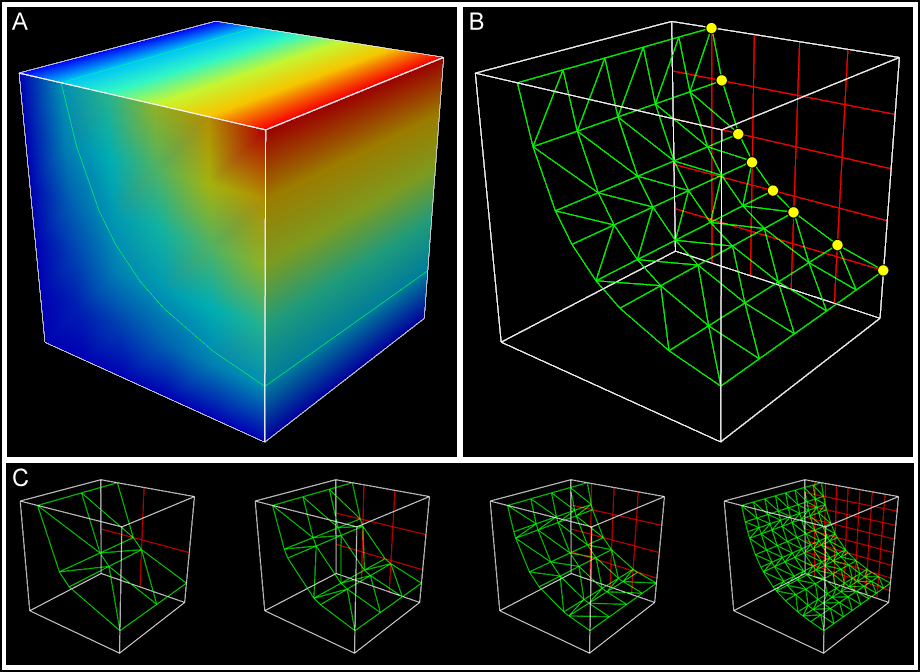
Figure 2: How tessellation affects iso-surface detail: The tessellation setting of the iso-surface sets the number of divisions in each xi direction within each element. Here, an iso-surface is used to connect every point within the element cube where "temperature" is 20. The "temperature" field is shown on the surface of the element cube using a spectrum in panel A. In B, the iso-surface is shown in wireframe (green) and a single face of the cube is divided up according to the tessellation setting. You can see that the iso-surface links the discretization divisions at points where the iso-scalar is at the chosen value. These intersections are indicated by yellow circles. Panel C shows how different tessellation settings affect this iso-surface; settings of 2, 3, 4, and 8 minimum divisions are shown.